PumpGTM Research · Technical report · v1.0
Who you reach and who writes: first-party evidence on targeting and message authorship in AI-assisted B2B outbound
Namanyay Goel · PumpGTM · November 9, 2026 · v1.0 · 11 pages
Paper PDFCode and aggregate data
First-party and observational, written by the company whose product it studies. Not peer reviewed.
Abstract
Which parts of an AI-assisted outbound program move response rates: who is contacted, or who writes the message? We looked at PumpGTM's own production data, frozen on November 7, 2026: 127,551 prospect records in 723 customer workspaces, after removing internal, demo and test workspaces. No new experiments were run.
People who had engaged with a related social post accepted LinkedIn connection requests at 57.1% against 20.3% for people found by model-planned filter search, a difference of 36.9 points (95% interval 10.3 to 49.1). That rests on 126 prospects in 7 workspaces, so it is a strong signal from a small sample. Who wrote the first message made no detectable difference: PumpGTM's in-product writer got a 14.7% reply rate and general-purpose AI assistants writing through PumpGTM's MCP got 13.2%, a tie. Whether adding email to LinkedIn raises replies is not yet measurable in this data.
What the comparison shows: targeting
The biggest differences in the data are between ways of building the list, not between ways of writing the message.
| List source | Workspaces | Requests | Accepted | Replied |
|---|---|---|---|---|
| People who engaged with a related post | 7 | 126 | 57.1% (31.5 to 68.9) | 27.8% (1.8 to 51.6) |
| List built by a general-purpose AI assistant | 37 | 2,050 | 27.7% (18.7 to 36.7) | 6.5% (2.0 to 12.0) |
| Model-planned filter search | 315 | 27,099 | 20.3% (18.2 to 22.4) | 2.7% (2.2 to 3.3) |
| In-app assistant list | 324 | 2,420 | 19.5% (17.1 to 21.8) | 2.4% (1.6 to 3.4) |
| Curated person list | 39 | 4,550 | 16.5% (13.3 to 20.6) | 1.1% (0.5 to 1.6) |
| Customer upload or exported list | 3 | 402 | 15.9% (10.5 to 16.8) | 2.2% (0.0 to 4.7) |
Per LinkedIn connection request sent at least 14 days before the freeze. Brackets are 95% intervals that resample whole workspaces (10,000 replicates).
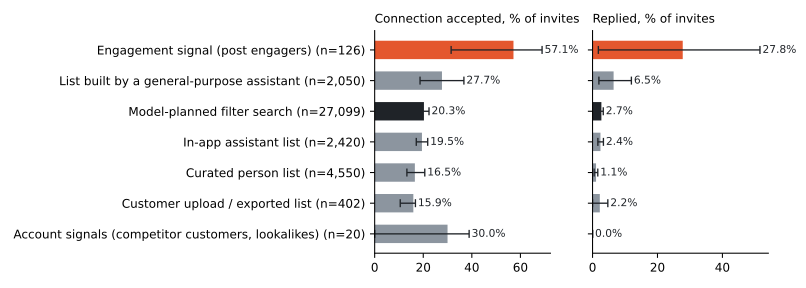
In the three workspaces that used both, people who engaged with a post accepted more often in all three (+36.0 points, 27.4 to 48.8). The reply difference points the same way but its interval crosses zero (-0.8 to +50.1 points). Lists built by customers' own AI assistants look better pooled, but inside the 15 workspaces that used both they match filter search (reply +1.7 points, -2.0 to +6.8), so the pooled gap mostly reflects which customers bring their own lists.
Filter search is fast: completed runs took a median of 7 seconds (90th percentile 45 seconds). Of the prospects customers decided on, 8.8% were rejected, most often for the wrong company segment or the wrong job function. There is no record of how long building a list by hand takes, so these numbers describe PumpGTM only.
A public case: Supermemory
Supermemory, whose results we have described publicly, shows what a narrowly targeted list can do. By November 3 its workspace had sent 524 connection requests and received replies from 23.7% of those people. At the freeze it stood at 588 requests, 56.6% accepted and 27.2% replied. Our team helped run this account and it is one workspace, so it is a case, not evidence about everyone. The full story is on the Supermemory customer page and in how we got Supermemory a 25% reply rate.
Who wrote the message: a tie
With the same sending system, copy written by PumpGTM's in-product writer and copy written by the customer's own AI assistant got the same reply rate within the margin of error.
| Who wrote the first message | Workspaces | Messaged | Reply rate |
|---|---|---|---|
| PumpGTM in-product writer | 194 | 2,699 | 14.7% (12.4 to 17.0) |
| General-purpose AI assistant over MCP | 74 | 1,351 | 13.2% (8.6 to 18.5) |
| Fixed template | 85 | 1,857 | 15.8% (12.2 to 19.5) |
| Written by the customer | 6 | 54 | 38.9% (0.0 to 57.1) |
Reply on any channel per connection who received a first message at least 14 days before the freeze. Writer minus assistant: +1.6 points (-3.6 to +6.1); on prospects from the same source, -1.2 points (-7.7 to +4.6).
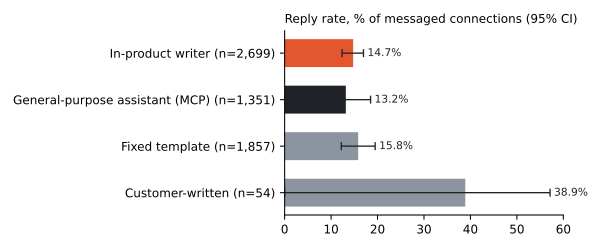
The baseline is guided, not generic. Assistants writing over MCP receive PumpGTM's written style rules and can run its campaign check, and the model behind them is chosen by the customer and not recorded. So this compares two PumpGTM-guided ways of writing; it says nothing about an unguided chatbot. Replies to assistant-written copy were also more often positive (60% against 49%, a difference just short of significance).
Channel mix: not yet measurable
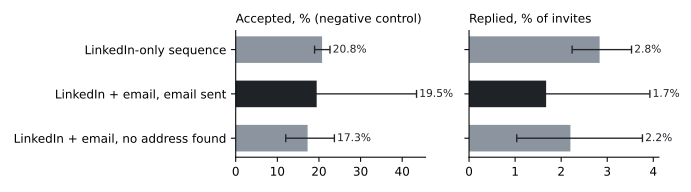
We wanted to test whether adding email to LinkedIn raises replies. The data cannot answer it yet. Email replies inside sequences have only been captured since October 15, and people who later received email had accepted the LinkedIn request 32 points more often than those who did not (5.7 to 63.0, in all six workspaces with both), although the request comes before any email. The two groups were different from the start. We will rerun this once email replies have been captured for a full period.
What was measured
- 127,551 prospect records in 723 customer workspaces, March to November 2026, read-only from PumpGTM's production database.
- Every revision of every sequence with its message text and who saved it, so each message is traced to the copy live when it went out.
- The list source of every prospect: filter search, post engagement, assistant imports, curated lists, uploads and account signals.
- Pooled rates with workspace-clustered bootstrap intervals, paired within-workspace contrasts where at least three workspaces used both options, and a negative-control outcome for the channel question.
Where the evidence stops
This is an observational, first-party report written by the company whose product it studies. It has not been peer reviewed. Customers chose where to find people and how to write, so differences can come from who the customers are. The targeting result comes from 7 workspaces. Meetings and revenue are almost never recorded and were not studied.
The supported conclusions are narrow: people with an engagement signal accepted far more often than searched lists in the workspaces that used them, and PumpGTM's in-product writer and guided general-purpose assistants performed alike. Nothing here shows that a list source raises meetings or revenue, or that multi-channel outreach works or does not.
Inspect and reproduce
The reproduction package holds the extraction definitions, the authorship and aggregation code, the anonymised aggregate dataset (counts by randomly coded workspace, arm and month, with no names, message text or workspace identifiers), the statistics and figure code, and the LaTeX sources. Running python3 analysis/stats.py on the released aggregates reproduces every number in the paper without database access.
PumpGTM's privacy policy covers using customer data to provide and improve the service and retaining anonymous, aggregated usage data for analytics. Neither it nor the terms of service addresses research publication, so this report publishes aggregates only.